Seven Quality Tools
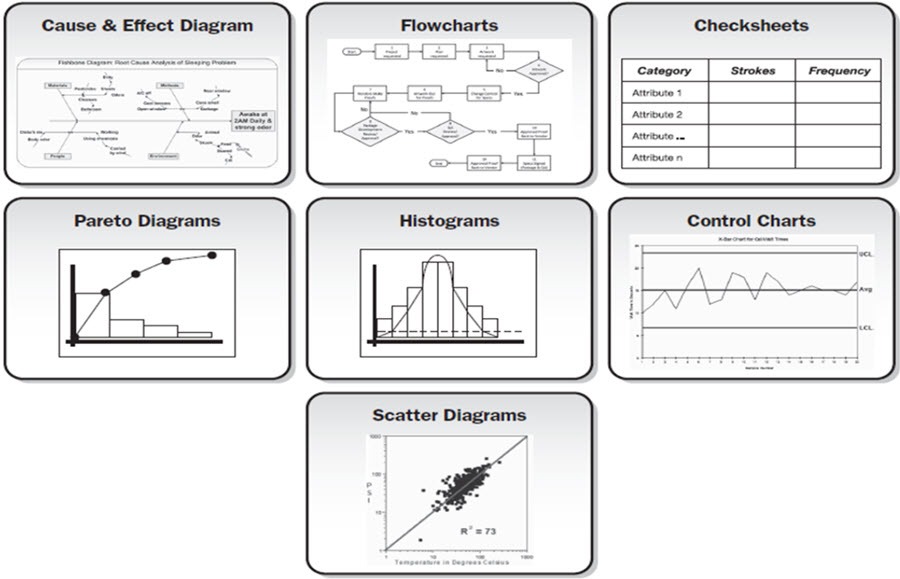
There are seven basic quality improvement tools that are used by Quality Circle teams, and are fundamental to the Total Quality Management, Total Quality Control, Lean, and Six Sigma initiatives.
- Cause and effect diagram (sometimes called Ishikawa diagram, or C&E diagram, or fishbone diagram)
- Pareto charts
- Process mapping and data gathering tools:
- check sheets
- Graphical tools:
- histograms
- frequency diagrams
- spot charts or measles charts or pictograms or defect concentration chart
- pie charts
- Run charts and control charts
- Scatter plots and correlation analysis
- Flowcharts
Inspired by Deming’s lectures, Kaoru Ishikawa formalized these into the Seven Basic Tools of Quality Control. He believed that 90-95% of a company’s problems could be improved using these seven tools. Aside from the control charts, these tools could be taught to any member of an organization as part of a quality circle.

Additional Resources
- Quality Circle– creativesafetysupply.com
- A Few Tools for Continuous Improvement– lean-news.com
- Utilizing The Right Tools To Implement The Kaizen Process– kaizen-news.com
- Using Excel for Data Analysis– blog.creativesafetysupply.com
- The Tools of Kaizen– blog.5stoday.com
- 5 Kaizen Tools to Start Using– hiplogic.com
- Visual Mapping Strategies, A Mess of Options– 5snews.com
- Vinyl Chart Tape – Ways To Improve Your Workplace– safetyblognews.com
- Six Sigma Belts– iecieeechallenge.org